Cliché – a phrase or opinion that is overused and betrays a lack of original thought
Example: see title of this Investment Insights
You will hear “Sell in May and Go Away” frequently in the financial media over the coming days. Stock markets were rough during April, and it’s just too easy a phrase to repeat when investors are already nervous.
The rationale goes that as large traders and senior investment strategists leave for vacations during the summer, the junior people left behind are charged with maintaining the status quo until the real decision makers return in September. Trading volumes become lighter and any disruption to markets could cause more than its normal share of volatility. That volatility could be in a downward direction since the junior people aren’t authorized to make any large buy decisions.
Does the cliché work?
We looked at data on the S&P 500 Index since the year 2000. In those 21 years from 2000-2021, sell in May and go away until September improved annual returns eight times versus holding from the beginning to the end of the year. That’s less than a 50% success rate. When it did work, the average improvement to annual returns was 8.2%. When it didn’t work, the average negative impact was -6.7%. Throw some simple weighted calculations around and what you get is a 21 year historical average calendar year payoff of 3.12% when it does work, and a historical average negative calendar year impact of -4.15% when it doesn’t work.1 This has not been a good trading strategy. “Sell in May and Go Away” is most valuable as a headline or TV segment lead.
Much more likely to impact stock markets are changes in expectations for interest rates, inflation, and real GDP growth because these factors impact earnings and valuations. Uncertainty pertaining to these three factors has been front and center this year, with the Federal Reserve serving as stage master. The first 25 basis point (0.25%) increase to the Fed Funds overnight lending rate occurred on March 16, 2022.
After the March meeting, various Federal Reserve Board Governors began speaking, and they didn’t hold back.
There has been somewhat of a hesitancy for equity markets to accept that the Fed does intend to tame inflation, even at the expense of GDP growth if necessary. The FOMC members drove that point home in their speeches and media interviews. Fed Chairman Jerome Powell summarized a month’s worth of comments by the Fed Governors when he stated during an International Monetary Fund Seminar on April 21 that moving faster and front-end loading interest rate hikes may be appropriate to expeditiously achieve neutral, and then potentially tight, monetary conditions if the economic data justify that decision.2

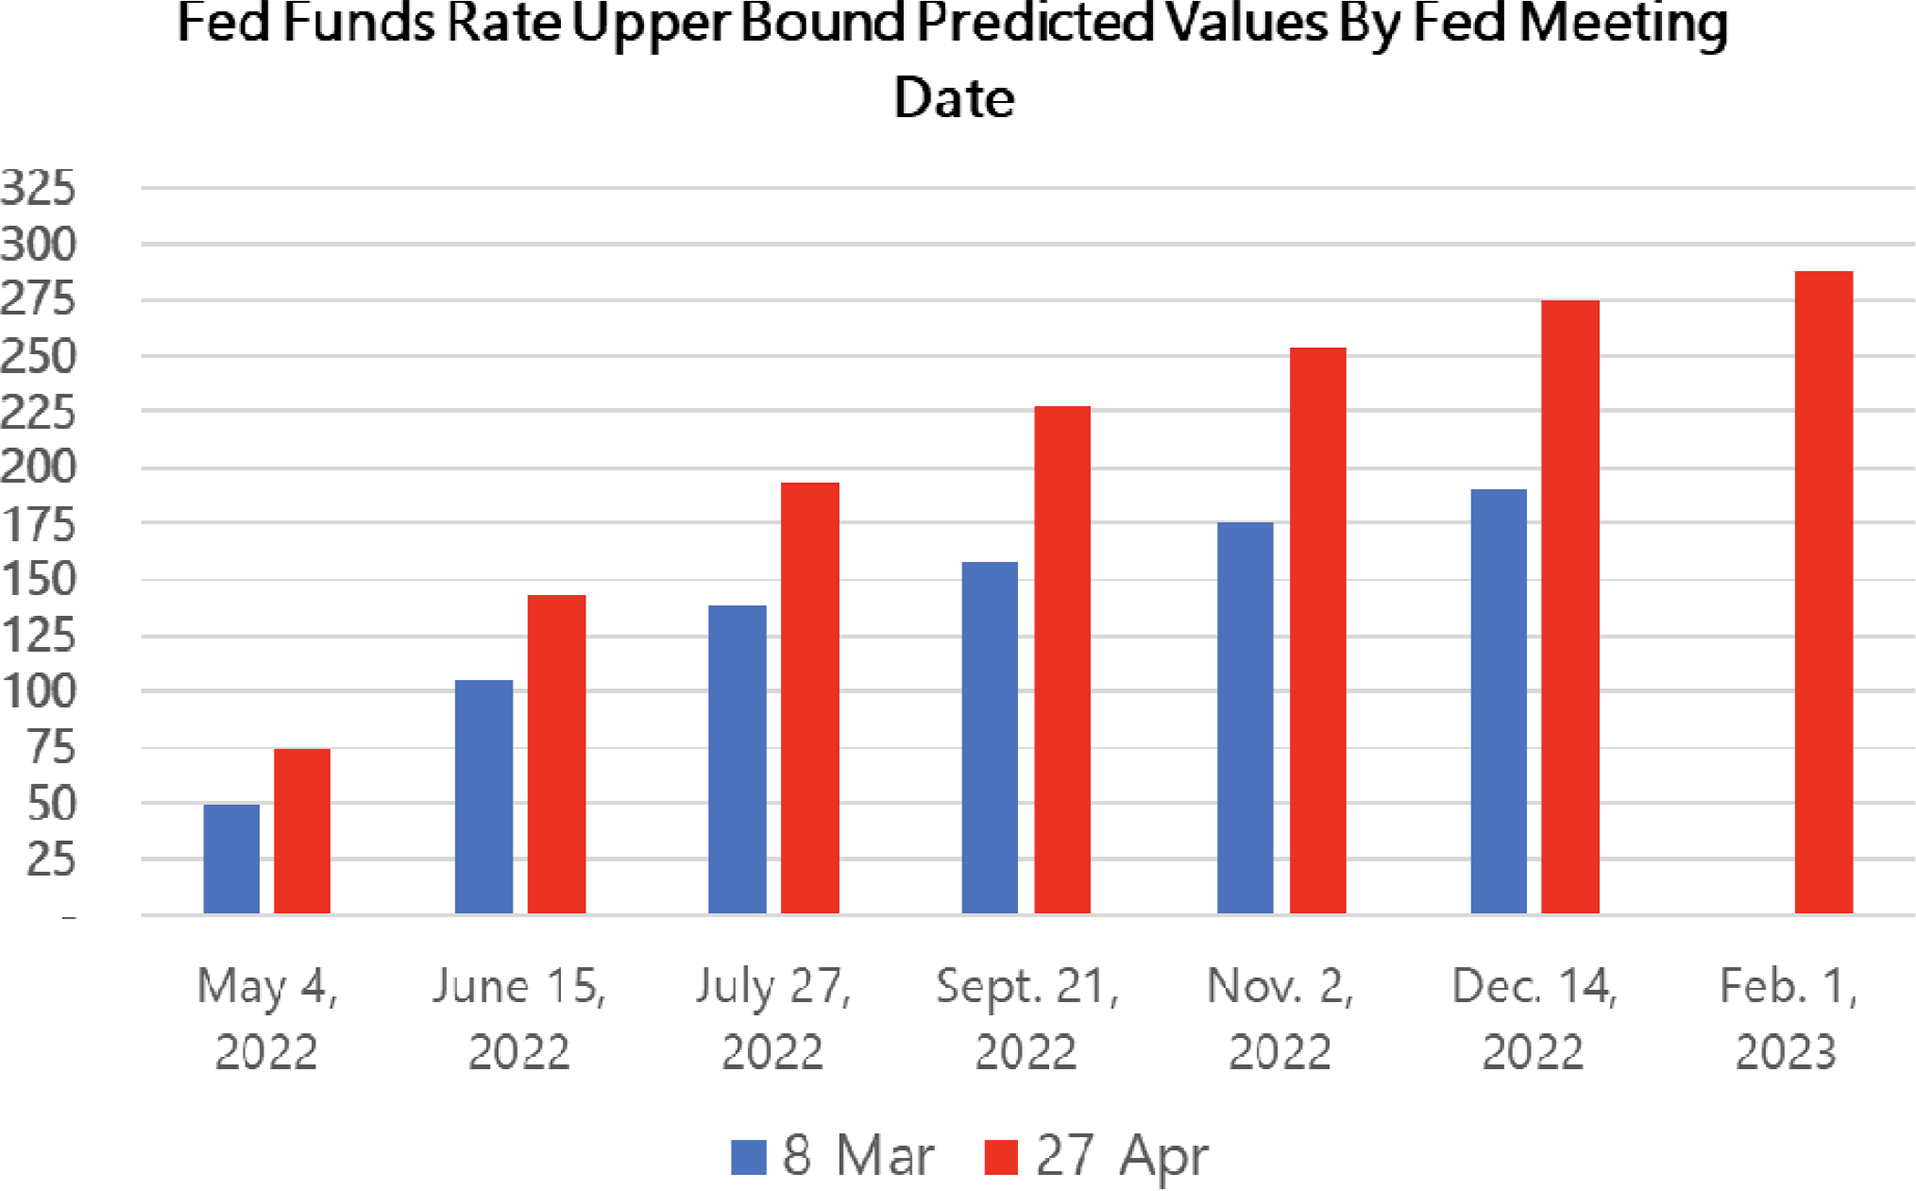
Data Source: CME FedWatch Tool
Chart Source: First Horizon Advisors
The speeches and interviews after the March 16 interest rate increase, combined with economic data showing strong growth and still-rapid inflation, was enough to convince the stock market that the Fed did indeed mean business. Expectations for future Fed Funds interest rate increases rose substantially from March 8 to April 27. These dates precede Fed meeting dates and show how a few weeks can result in a large change to market expectations leading up to a possible change in the Fed Funds Rate.

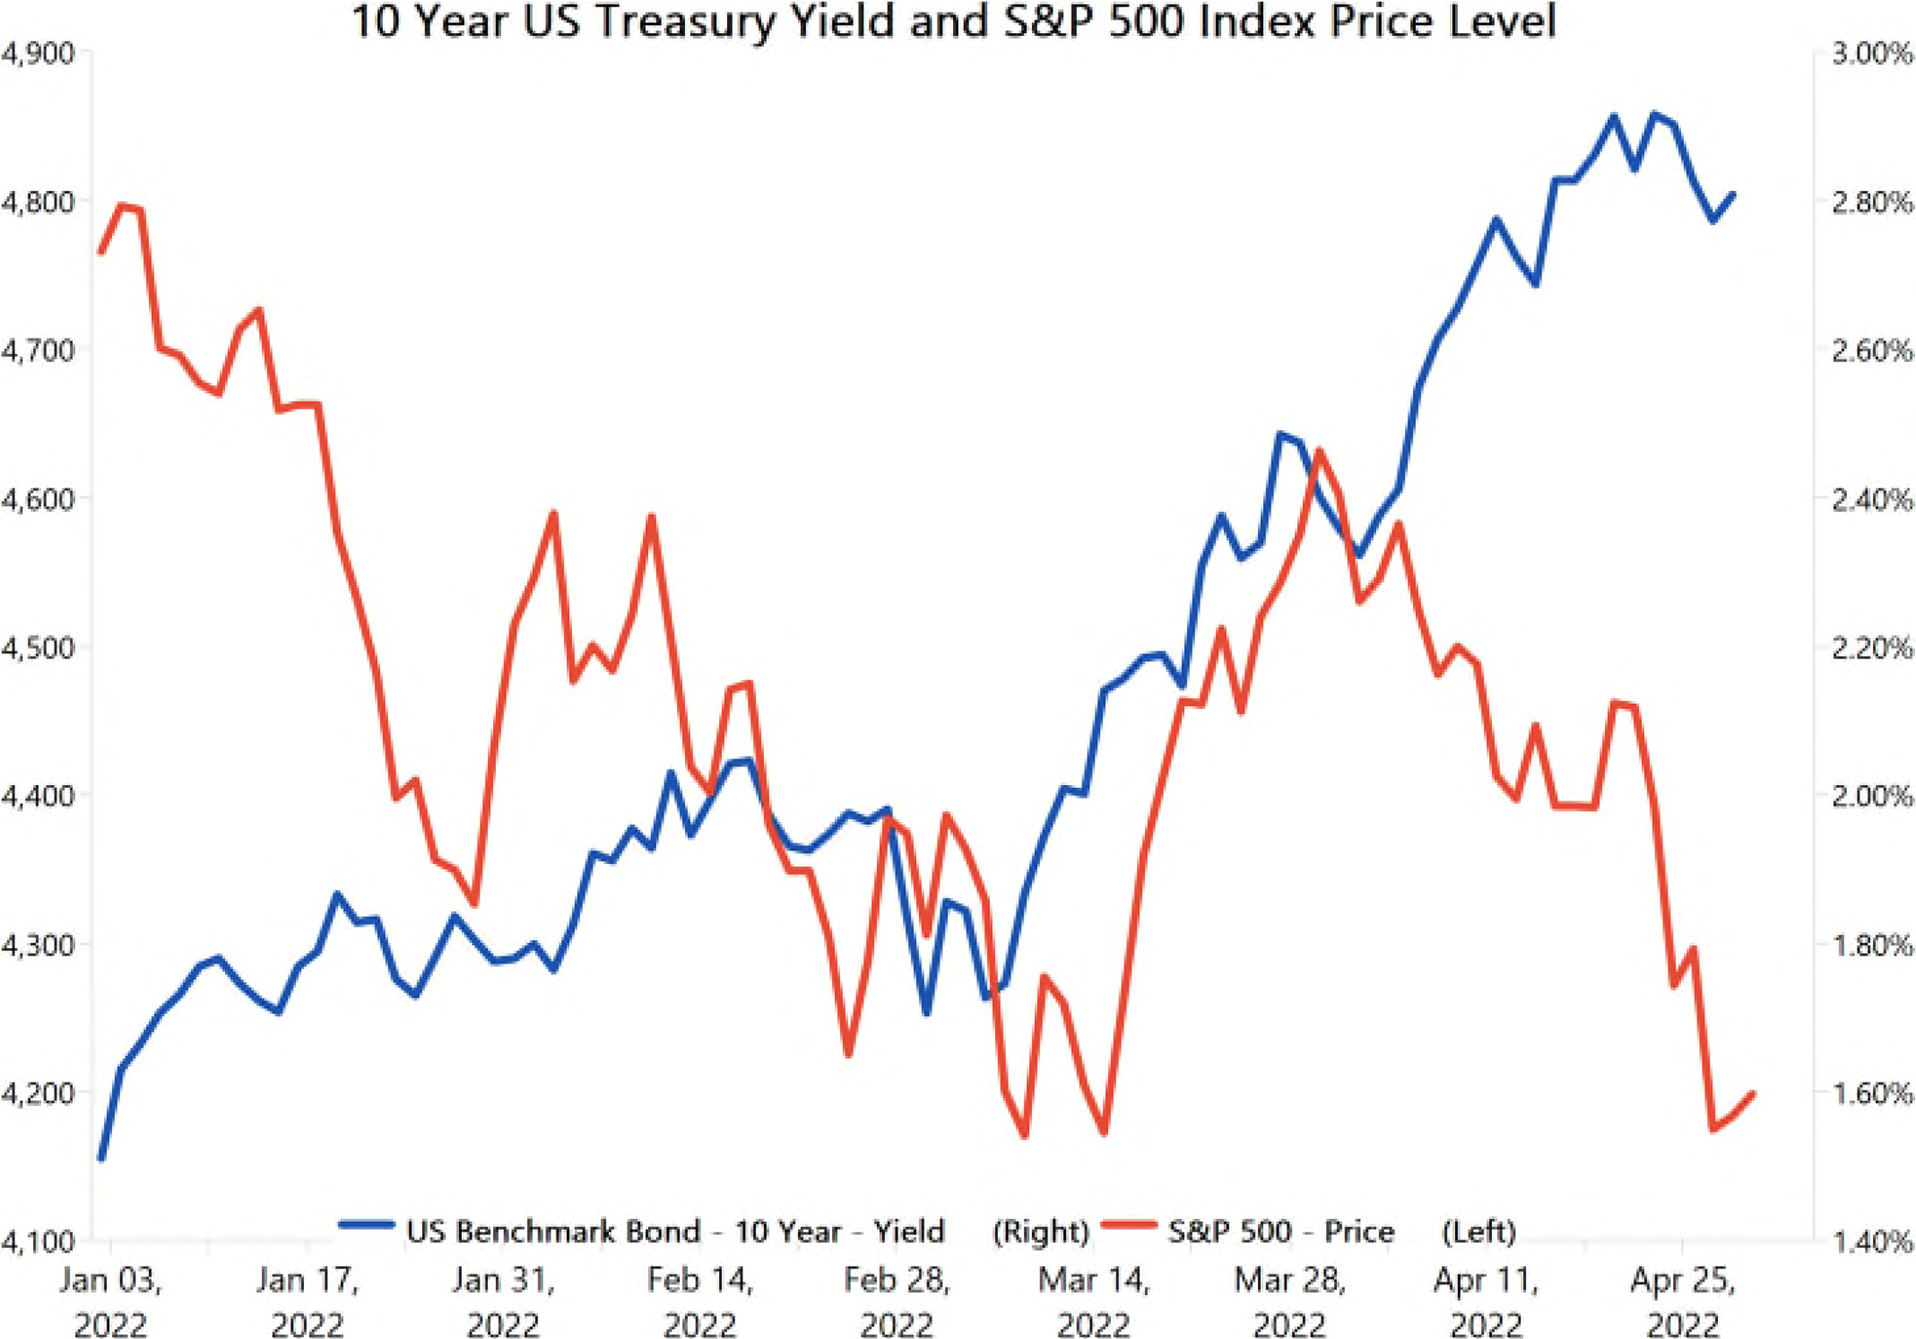
Source: FactSet
The S&P 500 Index (red line on the chart above) bounced above after the Fed’s March meeting, but all the hawkish inflation talk during April reversed that rebound. The stock index is now revisiting its mid-March lows.
The 10-year US Treasury yield (blue line on the chart above) had been climbing prior to the Fed’s March meeting, jumped after the meeting, experienced a small reversal, and then continued higher during April.
Stocks and bonds are both pricing in a more aggressive monetary tightening cycle than expected.
The balancing act in focus for the remainder of 2022, and likely into 2023, will be the tradeoff between economic growth and inflation. We wrote about this in our Investment Insights dated April 5, 2022. Seemingly right on time, the Bureau of Economic Analysis released the Advance Estimate of first quarter 2022 GDP the morning of April 28. You can find the data detail here should you wish to really dive into the weeds.
The headline number was a bit shocking.
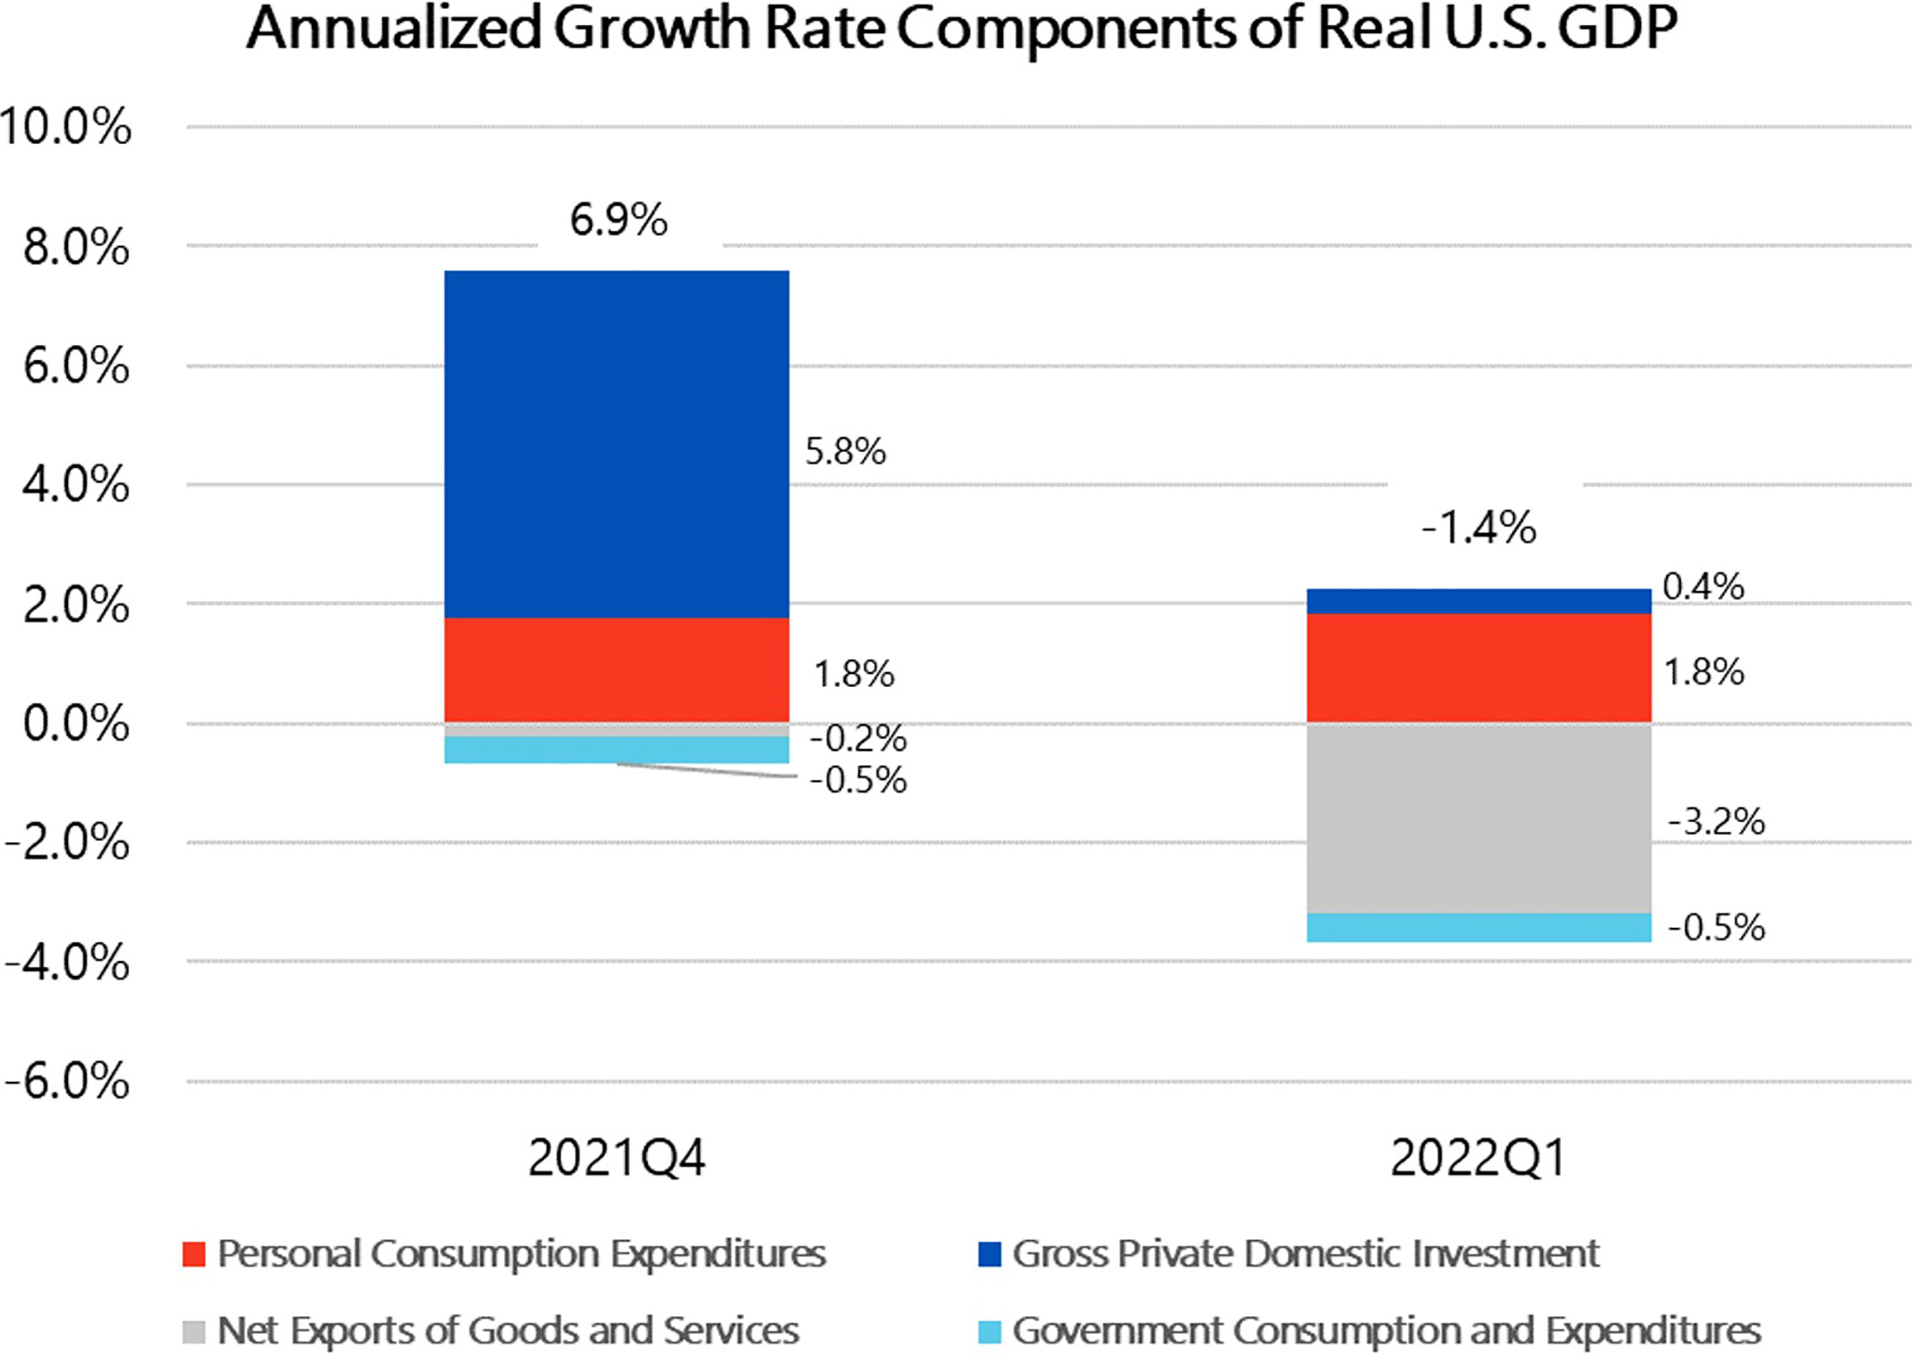
The first estimate of first quarter growth showed the economy contracted at a -1.4% annualized real rate3 against expectations for a 1.1% increase.4 But the real story was in the details. All economic and market data are experiencing larger-than-normal swings against trend as COVID impacts and our responses move through the economy. Simply looking at the headlines is not enough these days. The chart on the next page details the major components of GDP and compares the results from the fourth quarter of 2021 with the first estimate results for the first quarter of 2022.
There are several items that stand out to us to make this an overall okay GDP report given our current situation. The best part is the red bar of the stacked bar chart below. This is personal consumption expenditures, or PCE. PCE grew at a 1.8% annualized rate in both the fourth and first quarters.3 This is spending from individuals, and it so far remains steady. However, it has changed in its makeup.
During the pandemic, people were stuck at home and they spent on things, or “goods,” as defined within GDP. Now that spending is shifting from goods to experiences, or “services.”
The dark blue bar is domestic investment, or business spending. This component appears to have fallen dramatically; however, the details tell a different story. Business inventories are part of this measure. During the fourth quarter, inventories grew at a rapid 5.32% rate.3 They shrunk by -0.84% in the first quarter.3

Data Source: Bureau of Economic Analysis
Chart Source: First Horizon Advisors
An inventory drawdown after a rapid build is not unusual.
The more exciting components of business investment were healthy growth in equipment and software purchases. So even though it appears business investment spending slowed substantially, the difference was all explained by a change in inventories, while investment spending on longer-term items like equipment and software improved.
Net exports reduced first quarter GDP by -3.2%.3 That is a large number. For purposes of this measure, the Bureau of Economic Analysis (BEA) takes the net of exports minus imports.
If we sell (export) more than we buy (import), that is a positive contribution to GDP.
In the first quarter, we bought (imported) more than we sold (exported) by a wide margin, thus having a negative impact on GDP. This could be the result of a combination of factors. Ports are moving goods onshore faster now, the U.S. is growing faster than its trading partners, and there could have been buying ahead of the complicated geopolitical situation with Russia toward the end of the quarter as wholesalers worried again about inventories.
Finally, government spending at the federal, state, and local level contracted by -0.5%.3 This was the case last quarter, too, as pandemic-related spending subsided.
The takeaway from the first quarter GDP report is twofold. Inventories and trade (net exports) were responsible for large swings in the headline GDP number. These can be volatile data items in the best of times but are particularly prone to variation in times of shifting demand and uneven supply chains. The data with respect to consumer spending and business investment were steady and favorable.

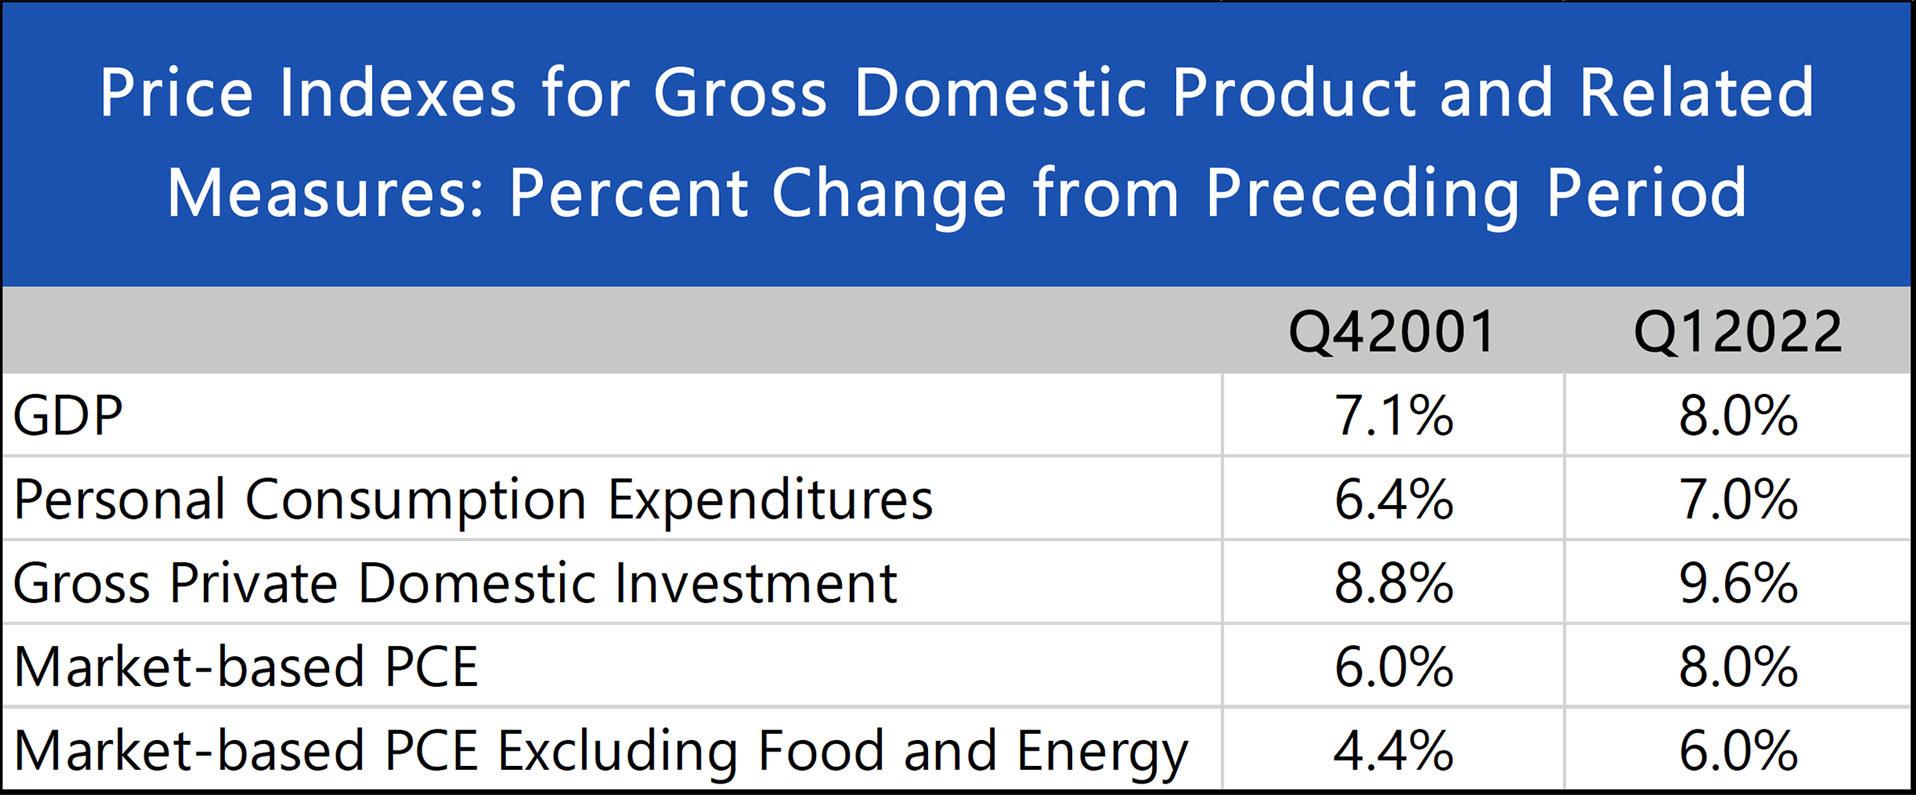
Data Source: Bureau of Economic Analysis
Table Source: First Horizon Advisors
The GDP data was not so good when it came to the price indexes. We won’t see another Consumer Price Index (CPI) reading until May 11, but there is some price data within the GDP report. These are quarterly numbers, and we already knew from the January, February, and March monthly CPI readings that we shouldn’t expect improvement. And that indeed was the case. Overall prices increased 8% in the first quarter after increasing 7.1% in the fourth quarter.3 The prices of each major GDP component accelerated quarter over quarter.3
It will take inflation some time to slow, but we and the markets are hopeful that a slowing is in the cards soon.
Tracy Bell, CFA
Director of Equity Strategies
The S&P 500 Index is regarded as a gauge of large cap U.S. equities. The index includes 500 leading companies and captures approximately 80% of the available market capitalization.
Presentation prepared by First Horizon Advisors – April 29, 2022.
Sources:
1 Data sourced from FactSet. Analysis by First Horizon Advisors
2 IMF Seminar: Debate on the Global Economy
3 Bureau of Economic Analysis
4 FactSet Consensus Estimates


